Debugging your Flutter app can be hard. But it does not have to be. Today, I will show you 5 Tips & Tricks that help you squeeze those pesky little bugs. This also includes best practices, special error-handling cases, and more!
Get a cup of coffee or tea ☕️ 🫖 and let’s get started!
#1: Don’t use print() — But also don’t use debugPrint()
We all know this linting error:
Don’t invoke ‘print’ in production code.
Okay, I got it. From now on, I will use debugPrint(). But did you know, that the output will still be shown in the release log?
You have two options to solve this:
- Use the logger package
var logger = Logger();
logger.d("Logger is working!");
2. You can also use log() function from dart:developer
import 'dart:developer';
log('This also works!');
#2: Handle app startup errors the right way
Did it ever occur to you, that you’ve opened an app, and it was simply stuck at the splash screen? The developers probably had code like this:
Future<void> main() async {
  await myStartupLogic();
  runApp(const MyApp());
}
If myStartupLogic throws an Error, the app will simply be stuck. Instead, do this:
Future<void> main() async {
  try {
    await myStartupLogic();
    runApp(const MyWorkingApp());
  } catch (e) {
    runApp(const MyErrorScreen());
  }
}
This way, your user knows that something has gone wrong.
#3: Know the actual size of widgets
It is no secret that Dart DevTools is an extremely underrated feature.
Do you feel the pain of trying to fix these dumb display issues and not knowing how big a widget actually is?
You won’t have to feel the pain anymore because you can display the size of each widget in the DevTools. Simply select the little icon that has two bars and two arrows between them (“Show Guidelines”), and the magic happens:

#4: Inspect your network requests
While we are at it, did you know, that you can inspect all your network requests in the DevTools too?
If you have ever developed a website or web app, you do know the Chrome Developer Tools. They come in very handy when you want to inspect how often you make requests to your backend, load an image, and much more. But how do you inspect them when running on an iOS or Android Simulator? Or a Mac app? Or Windows and Linux?
Head to the Network tab in DevTools, and voilà: All your network requests are beautifully listed, and ready to be optimized.
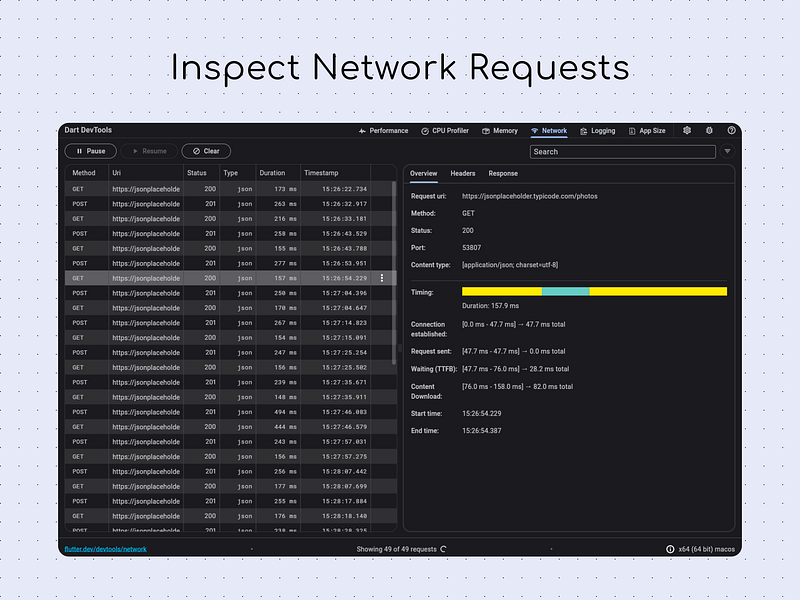
Image inside Image from Flutter Documentation
#5: Why is my app size so large?
Well… I can’t tell you the exact why. But I can tell you how you can find out. (Hint: With the DevTools)
First, you need to build your app with the --analyze-size flag:
flutter build apk —analyze-size —target-platform=android-arm64
Head to the App Size tab in DevTools, and select the generated JSON file. The boxes at the top show a tree map. The larger the box, the larger the size of the package, library, or class in your app. Now you can easily spot the big chunks in your app!
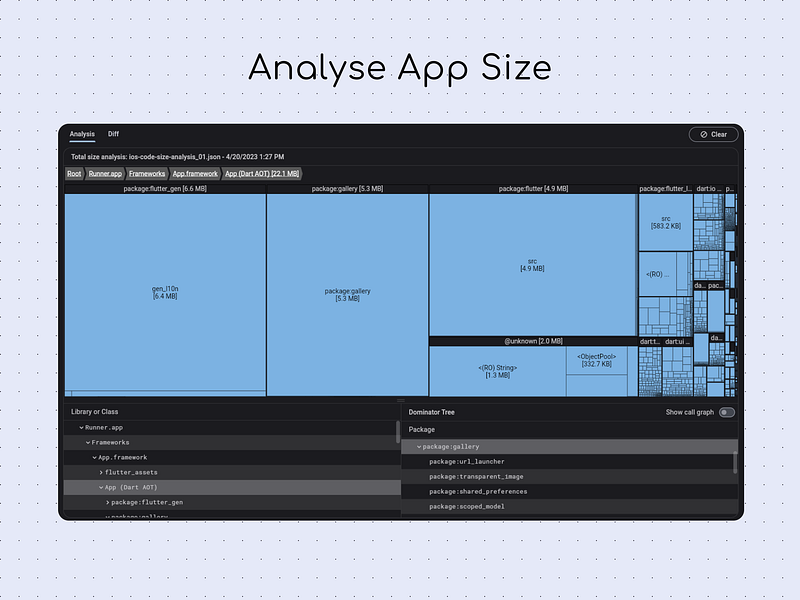
Image inside Image from Flutter Documentation
That’s it for today!
Did you enjoy this article? It would be a great help if you could just hit this “Clap” button once.
If you have loved this article, you should consider subscribing to my newsletter. In this, I cover:
- How Flutter operates internally
- Tips & Tricks for better coding, debugging, and testing
- Monthly newsletter featuring top monthly resources.
Head to tomicriedel.com and simply enter your email!
I wish you a great day and lots of success debugging your Flutter App!